Bitcoin just broke below the floor of its famous Rainbow Chart into the ‘BTC is dead’ zone
A 50% drop from recent highs has pushed the asset into a zone historically labeled as a dead end, sparking a debate among crypto analysts.
YayaNews contributes financial news and market context through the YayaNews editorial workflow.
Bitcoin just broke below the floor of its famous Rainbow Chart into the ‘BTC is dead’ zone
Markets
Bitcoin just broke below the floor of its famous Rainbow Chart into the ‘BTC is dead’ zone
A 50% drop from recent highs has pushed the asset into a zone historically labeled as a dead end, sparking a debate among crypto analysts.
By
Olivier Acuna
|
Edited by
Oliver Knight
Jun 24, 2026, 2:47 p.m.
4
min read
Make
preferred on
Share
Share this article
Copy link
X icon
X (Twitter)
Make
preferred on
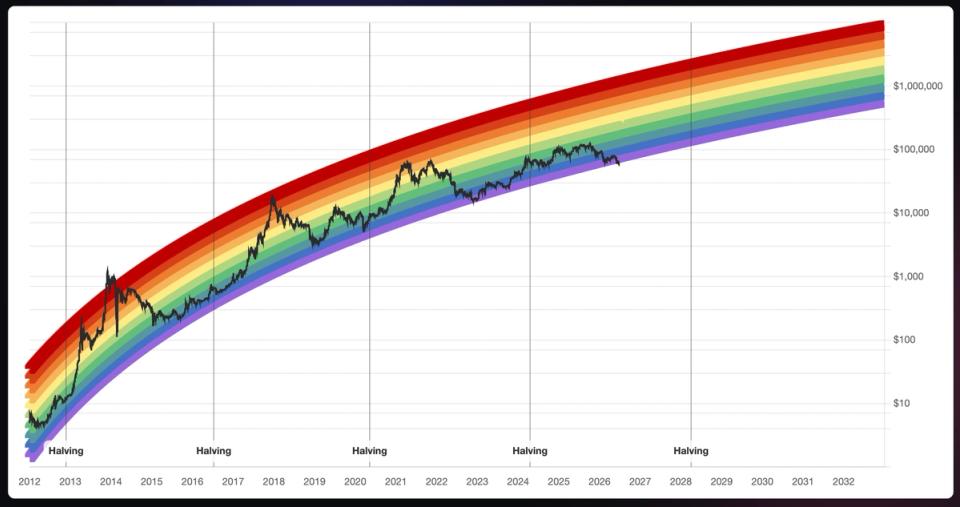
The point where bitcoin is today in regards to the Rainbow Chart is viewed by some bitcoin holders as a great buy opportunity. Others, view it differently. (Blockchaincenter.net)
Summary
Show
Bitcoin has fallen below the lowest band of the long-running Bitcoin Rainbow Chart for only the second time, dropping into the original model’s “Bitcoin Is Dead” zone around $62,500.
Analysts are split on whether the breach signals that bitcoin is deeply undervalued or that the Rainbow Chart itself is outdated as ETFs, institutional investors and macro forces reshape the market.
Many experts now view the Rainbow Chart and similar models as sentiment gauges rather than predictive tools, noting that bitcoin’s growing maturity and liquidity have weakened the four-year boom-and-bust patterns those models were built on.
Bitcoin has fallen below the lowest band of the popular Bitcoin Rainbow Chart for the second time in its history, a valuation model that has tracked BTC’s long-term price cycles for more than a decade.
Some of bitcoin's most fervent
holders believe the chart
is signaling a key buying opportunity.
CryptoRover drew comparisons on X
Wednesday with the last time it was in this zone of the rainbow in 2022, at $15,000 before a cycle bottom.
Bitcoin trades near $62,500, down roughly 50% from its
October 2025 all-time high of $126,000
. The decline has pushed BTC below the floor of the modern nine-band Rainbow Chart and into the original model's purple "Bitcoin Is Dead" zone, a level that has historically signaled extreme pessimism rather than a prediction about bitcoin's future.
The move has sparked debate among analysts over whether bitcoin is deeply undervalued or whether the
Rainbow Chart
itself is becoming less useful as institutional investors, exchange-traded funds (ETFs) and macroeconomic forces play a larger role in the market.
The Rainbow Chart was developed by
Reddit user Azop in 2014
. It uses a logarithmic growth curve to track bitcoin's long-term price trend and places the asset into colored bands that correspond with different stages of market sentiment.
Analysts disagreed on what the breach means for bitcoin and the Rainbow Chart itself.
"The first time price breaks below a band that has held for over a decade indicates that there's a structural shift in the model,” Markus Levin, co-founder of XYO, told CoinDesk. “I do not read this as bitcoin being dead, I read it as the Rainbow Chart being dead, and that is actually a bullish statement about how far the asset has matured.”
Still a useful reference
Ryan Lee, Bitget's chief analyst, disagreed. "The Rainbow Chart remains a useful reference for visualizing long-term market cycles, but it should not be viewed as a predictive model," he said.
"The chart is based on logarithmic regression and historical price behavior instead of fundamental, macroeconomic, or market structure variables that increasingly influence bitcoin today,” Lee added.
Emad Shahin, COO of Ethra, said the chart works better as a measure of sentiment than as a forecasting tool.
"The Rainbow Chart is a fitted regression with a sense of humor, not a forecasting tool," Shahin told CoinDesk. "These charts are useful as sentiment cartoons. They capture mood but the moment you treat them as predictive, they fail you at exactly the turning points you most wanted them to call."
Bitcoin peaked at $126,000 in October without reaching the Rainbow Chart's upper red bands. Now, with BTC near $62,500, the price has fallen below the chart's floor.
The divergence comes as other widely followed bitcoin valuation models have also struggled. The
Stock-to-Flow model
, which links bitcoin's price to its programmed supply reductions, projected significantly higher prices following the 2024 halving than bitcoin ultimately achieved.
Mark Zalan, CEO of GoMining, agreed that the bottom band does not indicate a permanent collapse.
Bitcoin dead zone
"The 'Bitcoin is Dead' zone doesn't mean Bitcoin is actually dead," Zalan told CoinDesk. "Historically, it has often marked periods of extreme fear and undervaluation, which were later followed by recoveries. It signals sentiment more than certainty."
Zalan said the chart remains useful, but "less precise than it once was."
"The 2025 cycle showed that BTC doesn't have to follow old patterns exactly," Zalan said. "ETFs, institutions and changing market structure have altered the game."
Bitcoin is trading near its
April 2024 halving
price, a development that runs counter to expectations for the current four-year cycle.
Levin said the chart confirms what the “cycle data has been showing us, the exponential growth assumptions baked into this chart were calibrated to a retail-driven, illiquid asset, not a $1.25 trillion market with ETF flows and institutional balance sheets setting the marginal price."
"The chart is starting to describe an asset that no longer behaves the way it used to," Levin said.
"These bands are a regression fitted to violent four-year cycles, but that volatility may be draining out as institutional capital and ETF flows turn bitcoin into a steadier, more liquid asset," Levin said.
Increasing institutional participation
Lee also spoke of how, with
increasing institutional adoption
and participation, “ETF flows, derivatives activity, and macro conditions play a larger role in price discovery, historical models alone have become less reliable as standalone indicators."
Lee said weak sentiment does not necessarily mean further declines are inevitable.
"Current positioning near the lower end of the Rainbow Chart suggests sentiment has weakened, but it does not necessarily imply that substantially lower lows are ahead," Lee said.
"A move toward the low-$50,000 range cannot be ruled out if risk sentiment deteriorates further, but the chart itself offers limited insight into where a definitive market bottom may form."
Whether bitcoin rebounds back into the Rainbow Chart's historical range or continues to trade outside it may determine whether the model remains a useful framework for investors or joins a growing list of crypto valuation models that no longer reflect how the market behaves.
Bitcoin News
Latest Crypto News
1
Asset management giant Invesco files for tokenized fund targeting stablecoin reserve market
6 hours ago
2
Coinbase's Base blockchain resumes after two-hour outage disrupted network
8 hours ago
3
Strategy's yield-generating STRC stock is more correlated with BTC than ever
9 hours ago
4
Kraken in talks to buy 15% stake in DeFi lender Aave at $385 million valuation
9 hours ago
5
a16z-backed crypto firm rebrands, shifts focus to solving AI’s global copyright headache
10 hours ago
6
BlackBerry is making a massive comeback as an 'uncrashable' software layer for AI and robotics
11 hours ago
7
Strategy has a 10-month cash runway for dividends, but retail investors are losing faith
11 hours ago
8
Quant fund says bitcoin is near a major inflection point as rare onchain signals align
11 hours ago
9
Bitcoin tumbles to new multi-year low of $58,000, but a short-squeeze setup emerges
12 hours ago
10
Crypto for Advisors: Bitcoin: planning for inheritance
12 hours ago
Latest Research
CEX Volumes Drop to Lowest Since September 2024 as RWA Perps Hit Record High
CEX Volumes Drop to Lowest Since September 2024 as RWA Perps Hit Record High
In May, combined exchange volumes fell 3.45% to $4.41T; the lowest since September 2024. RWA perpetual futures volumes rose 10.4% against the trend, hitting a new all-time high.
By
CoinDesk Research
Jun 15, 2026
In May, combined exchange volumes fell 3.45% to $4.41T; the lowest since September 2024. RWA perpetual futures volumes rose 10.4% against the trend, hitting a new all-time high.
Why it matters
:
In May, combined exchange volumes fell 3.45% to $4.41T; the lowest since September 2024. RWA perpetual futures volumes rose 10.4% against the trend, hitting a new all-time high.
View Full Report
More From
Markets
Strategy's yield-generating STRC stock is more correlated with BTC than ever
BlackBerry is making a massive comeback as an 'uncrashable' software layer for AI and robotics
Strategy has a 10-month cash runway for dividends, but retail investors are losing faith
CD20
$1,570.23
CD20 down 4.06 percent
4.06%
BTC
$58,810.83
BTC down 3.28 percent
3.28%
ETH
$1,529.88
ETH down 5.39 percent
5.39%
XRP
$1.02
XRP down 4.88 percent
4.88%
SOL
$66.94
SOL down 0.96 percent
0.96%
Original YayaNews editorial coverage, published for informational purposes.
This article is sourced from CoinDesk. It is for informational purposes only and does not constitute investment advice.
Topics & Symbols
Continue Reading
Related Reading
Strategy’s $13 billion paper loss dwarfs dogecoin, BlackRock's BUIDL and hundreds of other tokens
Strategy’s paper loss exceeds the market caps of hundreds of tokens, highlighting the extreme concentration of risk in the crypto market right now.

Live markets: Bitcoin rebounds to nearly $60,000. Kospi, Nikkei sink
BTC sees a relief bounce as Asian stocks wilt following sharp losses on Wall Street.

Ether, XRP, DOGE price news: Majors lead a broad crypto selloff as tech stocks tumble
Bitcoin slipped near $58,000 before recovering, and CF Benchmarks says the $50,000 to $60,000 zone is where buyers have always stepped in.

Base Resumes Block Production After 2-Hour Outage
The Coinbase-backed blockchain Base returned online after two hours of downtime due to a consensus problem that prevented the creation of new blocks.