Ethereum ETF First Week: Capital Flows and Price Trends in Depth, Compared to Bitcoin ETF History
A professional analysis of Ethereum spot ETF's first-week net inflows/outflows, price volatility, and market sentiment, contrasted with Bitcoin ETF's historical debut to guide investors.
YayaNews contributes financial news and market context through the YayaNews editorial workflow.

Ethereum ETF First Week: Deep Dive into Capital Flows and Price Trends
In July 2024, the U.S. Securities and Exchange Commission (SEC) officially approved the listing of spot Ethereum ETFs, marking another milestone for the crypto market after Bitcoin ETFs. With first-week trading data now available, market participants are closely watching the impact of this new product on Ethereum's price and overall sentiment. This article provides a professional analysis from perspectives including net capital inflows/outflows, price performance, and historical comparison with Bitcoin ETFs.
First-Week Capital Flows: Net Inflows Dominate, but with Notable Volatility
According to preliminary data from multiple platforms, spot Ethereum ETFs saw cumulative net inflows of several hundred million dollars in their first week (July 23–27). Products from leading issuers like BlackRock and Fidelity attracted the bulk of the capital, while Grayscale's ETF converted from its Ethereum trust experienced significant net outflows. This mirrors the early days of Bitcoin ETFs—investors shifted from high-fee trust products to low-fee ETFs, causing persistent outflows from Grayscale's offerings.
Specifically, net inflows were strong in the first three trading days but turned slightly negative in the last two, showing a "rise then fall" pattern. Market analysts note that some early buying may have come from hedge funds and arbitrage traders rather than long-term allocators.
Price Action: Rally Then Retreat, Volatility Expands
Ethereum's price briefly surged to around $3,500 on the ETF's first day but gradually retreated, closing the first week at approximately $3,200, with weekly gains narrowing to single digits. This resembles Bitcoin's post-ETF performance—Bitcoin briefly hit $49,000 after its January 2024 ETF launch, then corrected to around $42,000 within two weeks.
From a volatility perspective, Ethereum's average daily range exceeded 5% in the first week, significantly higher than the ~3% seen the week before. This suggests the ETF launch amplified short-term market divergence: institutional inflows provided support, while some profit-takers exited on the news.
Comparison with Bitcoin ETF History: Similar but Different
Looking back at Bitcoin spot ETFs after their January 2024 debut: first-week net inflows were about $1.5 billion, with prices rising from $46,000 to $49,000 before a ~20% correction. Ethereum ETFs saw first-week net inflows roughly one-tenth of Bitcoin's. Given Ethereum's market cap is about one-third of Bitcoin's, this ratio is broadly in line with expectations.
Key differences: Bitcoin ETFs launched amid optimism over the halving cycle, while Ethereum ETFs face a more complex macro environment—fluctuating Fed rate cut expectations and rising U.S. election uncertainty. Additionally, Ethereum's staking yield mechanism makes some investors prefer staking for returns over holding ETFs, potentially dampening ETF appeal.
Market Sentiment: From Euphoria to Rationality
According to Alternative.me's Fear & Greed Index, market sentiment was in "Extreme Greed" (above 75) before the Ethereum ETF launch, but fell to "Greed" (around 65) by week's end. Social media buzz about "Ethereum breaking all-time highs" has waned, replaced by questions about capital sustainability. Professional investors generally believe the ETF's long-term impact will take at least 3–6 months to fully materialize, and short-term price swings are normal.
Risk Warning
The above content is for reference only and does not constitute investment advice. The cryptocurrency market is highly volatile, and ETF products face risks including liquidity, regulatory changes, and sentiment reversals. Investors should make prudent decisions based on their own risk tolerance.
Disclaimer
This article is for informational purposes only and does not constitute investment advice. Financial markets carry risk; invest with caution. Data and views are as of the time of writing and may change with market conditions.
Start Your Trading Journey
Yayapay offers secure and convenient global asset trading services. Register Now →
Original YayaNews editorial coverage, published for informational purposes.
This article is authored by YayaNews. It is for informational purposes only and does not constitute investment advice.
Topics & Symbols
Continue Reading
Related Reading
Surging U.S. IPO market still falls short of bubble territory: Goldman Sachs
U.S. IPO issuance has rebounded sharply in 2026, but the bank said the current surge lacks the deal volume and speculative excess that defined the dot-com era.

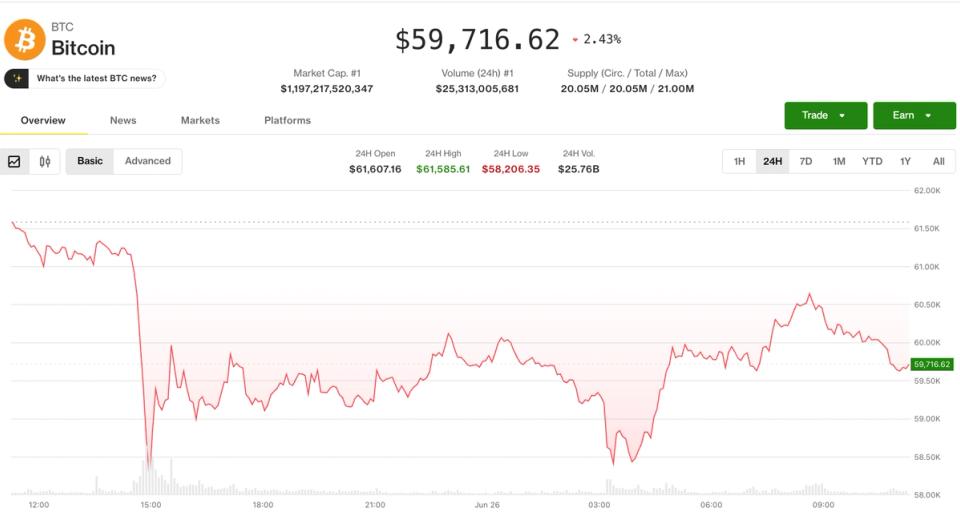
Crypto market clings to support as bitcoin hits 21-month low: Crypto Markets Today
BTC touched its lowest level since September 2024 before bouncing to $59,770, while ETH slipped further and another $1 billion in futures positions were wiped out.
Strategy STRC June 30 ex-dividend date and dividend rate reset explained
Investors are watching the preferred stock's ex-dividend date and monthly dividend rate reset closely.

Japanese giant SBI Holdings to buy Bitbank for $289 million
SBI said the acquisition, which is subject to regulatory approval, is set to close in October.